Off-Grid Solar Energy Market Size and Share
Market Overview
| Study Period | 2021 - 2031 |
|---|---|
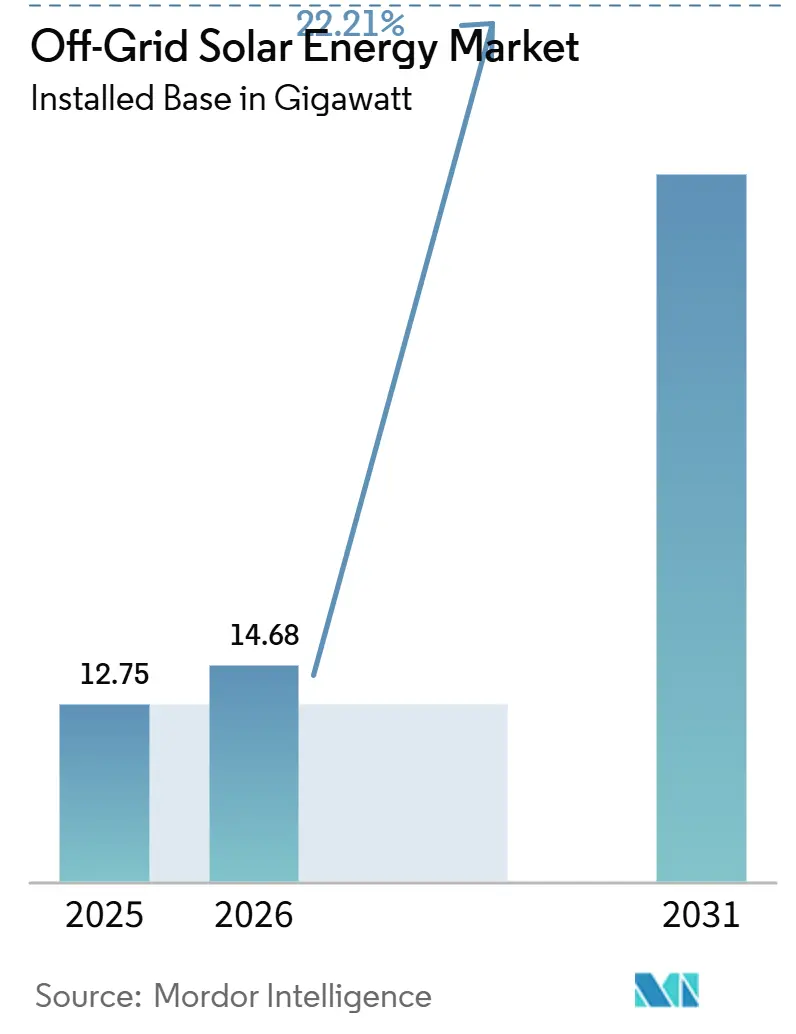
| Market Volume (2026) | 14.68 gigawatt |
| Market Volume (2031) | 40.02 gigawatt |
| Growth Rate (2026 - 2031) | 22.21% CAGR |
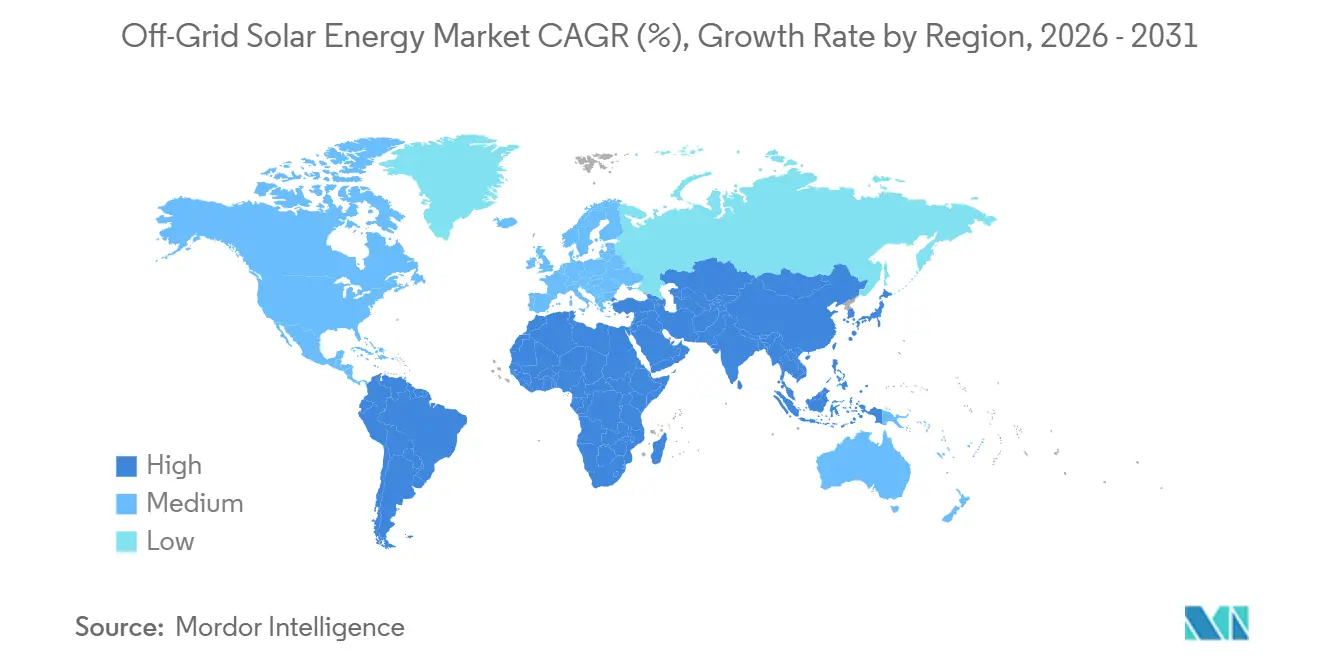
| Fastest Growing Market | Middle East and Africa |
| Largest Market | Asia-Pacific |
| Market Concentration | Medium |
Major Players*Disclaimer: Major Players sorted in no particular order Image © Mordor Intelligence. Reuse requires attribution under CC BY 4.0. | |
Off-Grid Solar Energy Market Analysis by Mordor Intelligence
The Off-Grid Solar Energy Market size in terms of installed base is expected to grow from 12.75 gigawatt in 2025 to 14.68 gigawatt in 2026 and is forecast to reach 40.02 gigawatt by 2031 at 22.21% CAGR over 2026-2031.
Three structural shifts underpin this steep curve: lithium-ion battery packs averaged USD 108 per kWh in 2025 after an 8% annual drop, stationary storage systems hit USD 70 per kWh, and perovskite–silicon tandem modules moved into pilot production at 27.3% efficiency.[1]Lily Ritchie, “Battery Pack Prices Fall to USD 108/kWh,” BloombergNEF, about.bnef.com Development finance is amplifying these technology gains. Mission 300 has committed 17 African nations to electrifying 300 million people by 2030, bundling mini-grid tenders that de-risk private capital.[2]World Bank Staff, “Mission 300 Compact,” World Bank, worldbank.org At the same time, Beijing’s April 2026 removal of the 9% export VAT rebate and record silver prices narrowed module margins, signaling that historic price deflation may ease just as volumes scale PV.[3]Max Hall, “China Ends 9% Export Rebate,” PV Magazine, pv-magazine.com On the demand side, telecom operators replacing diesel gensets at more than 50,000 tower sites across Sub-Saharan Africa and South Asia illustrate how commercial users are driving multi-day autonomy solutions that would have been uneconomic even three years ago.
Key Report Takeaways
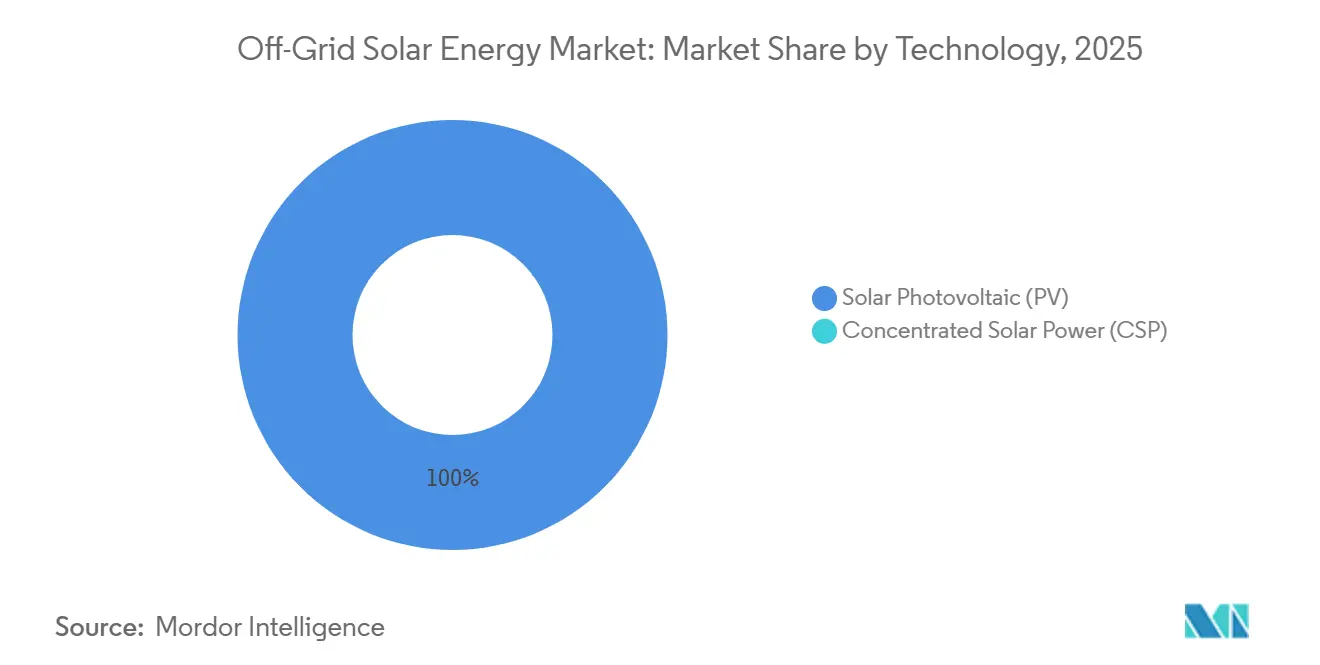
- By technology, solar photovoltaic retained 100% share of installed capacity in 2025 and is expected to move in lockstep with the overall 22.21% CAGR.
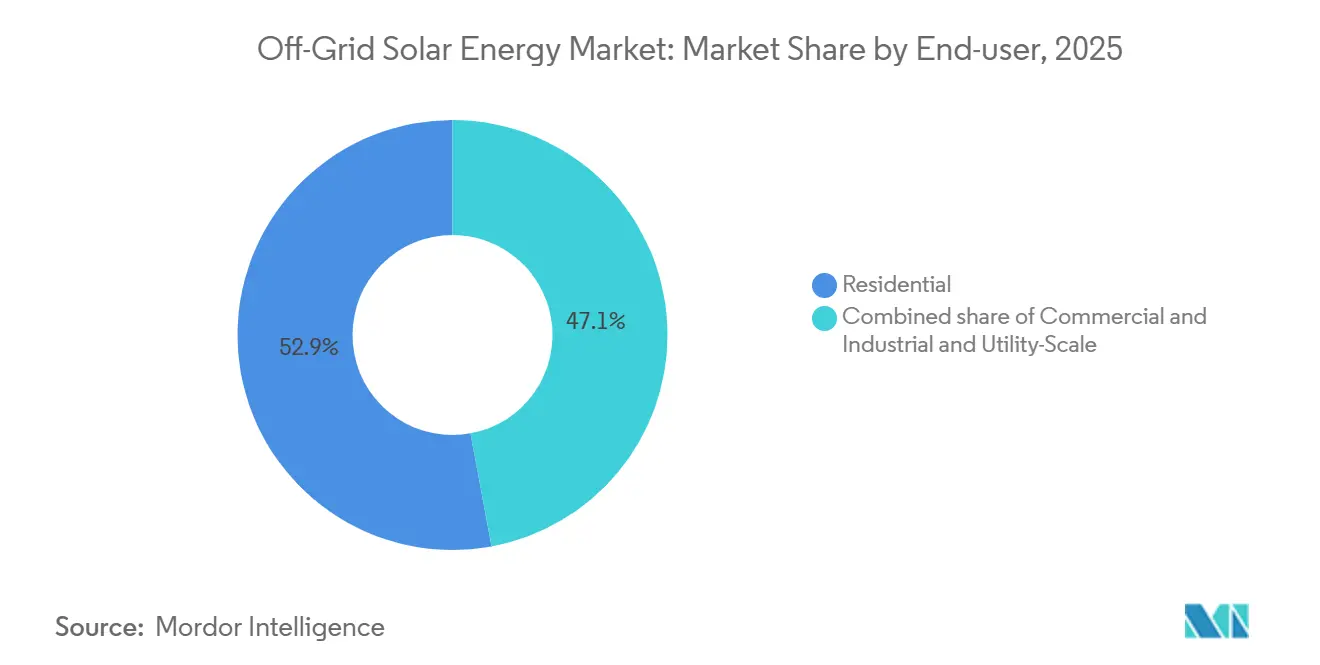
- By end-user, residential systems led with 52.9% of the off-grid solar energy market share in 2025. Commercial and industrial installations are forecast to expand at a 26.8% CAGR to 2031, the fastest among all end-users.
- By geography, Asia-Pacific commanded 59.87% capacity in 2025, while the Middle East and Africa region is projected to post a 26.3% CAGR through 2031.
- Trina Solar captured 30% of incremental bifacial module shipments in 2024, the largest technology-specific share reported among the top four Chinese manufacturers.
Note: Market size and forecast figures in this report are generated using Mordor Intelligence’s proprietary estimation framework, updated with the latest available data and insights as of January 2026.
Global Off-Grid Solar Energy Market Trends and Insights
Drivers Impact Analysis
| Driver | (~) % Impact on CAGR Forecast | Geographic Relevance | Impact Timeline |
|---|---|---|---|
| Falling PV module prices & efficiency gains | 5.20% | Global, with price leadership in China | Medium term (2-4 years) |
| Rising rural electrification targets | 6.80% | Sub-Saharan Africa, South & Southeast Asia | Long term (≥ 4 years) |
| Declining Li-ion battery cost curve | 4.50% | Global, lowest prices in China | Short term (≤ 2 years) |
| Pay-go fintech integration boosts affordability | 3.10% | East & West Africa, South Asia | Medium term (2-4 years) |
| ESG-linked debt lowers cost of capital | 2.30% | Global DFI-backed funds | Long term (≥ 4 years) |
| Utility mini-grid tender bundling | 1.80% | Nigeria, India, Indonesia | Medium term (2-4 years) |
| Source: Mordor Intelligence | |||
Falling PV Module Prices & Efficiency Gains
Polysilicon oversupply held China FOB module prices near USD 0.12 per watt in 1H 2026, yet costs stabilized when the 9% export VAT rebate ended, and high silver prices added 3–4% to cell inputs PV. Tandem innovation partly offsets these headwinds: Oxford PV started 27.3% modules in May 2024 and targets 7.5 GW capacity by 2029, while LONGi’s lab record reached 33.9% in April 2024.[4]Frank Hoxey, “Oxford PV Starts 27.3% Module Line,” Oxford PV, oxfordpv.com Commercial modules topping 26% efficiency could enter the off-grid solar energy market by 2027 and lower balance-of-system spending up to 20%. Bifacial designs such as LONGi’s Hi-MO 9 already secure 5–30% extra yield on high-albedo sites, and thin-film cadmium-telluride remains niche because tellurium scarcity caps global output below 10 GW. Yet perovskite durability and lead content are unresolved, with possible IEC 61215 rule changes creating 12–18 months of certification lag.
Rising Rural Electrification Targets
Mission 300 mobilized USD 1.85 billion for Nigeria’s DARES program alone, bundling 1,350 mini-grids to serve 17.5 million people. India’s PM-KUSUM set a 30.8 GW target but reached only 2.8 GW by mid-2024 because 40–50% farmer co-payments stalled uptake in low-credit states. The International Solar Alliance calculates 59% of the 396 million unelectrified people are better served by mini-grids, yet the financing gap is forty-nine times current capital flows. Indonesia’s 2,500 unelectrified villages illustrate last-mile risk: PLN’s USD 0.15 per kWh tariff cap drags IRRs below 8%, deterring private bidders without sovereign backing.
Declining Li-ion Battery Cost Curve
Average pack prices slid to USD 108 per kWh in 2025, and stationary LFP systems fell to USD 70 per kWh, cutting a 10 kWh three-day-autonomy set to USD 700 for cells alone. China’s domestic packs cleared at USD 84 per kWh, 44–56% below North American and European equivalents, accentuating regional cost asymmetry. Tesla’s Lathrop line ramped to 40 GWh, yet its Powerwall 3 pursues grid-tied homes, leaving sub-5 kWh solar-home demand to Chinese makers. CATL’s sodium-ion launch at USD 60 per kWh broadens chemistries for mini-grids where energy density is secondary.
Pay-Go Fintech Integration Boosts Affordability
Mobile-money ecosystems financed 50 million people by 2025, but default rates climbed from 18% in 2021 to 30% in 2023 as irregular income and misunderstood terms surfaced. M-KOPA extended USD 1.6 billion in credit to 4.8 million Kenyans, while d.light securitized USD 842 million across five tranches, using multi-currency structures that hedge forex swings yet add 150–200 bps to costs. Only 22% of energy-needy households can meet Tier 1 system payments without subsidy, underscoring the poverty premium.
Restraints Impact Analysis
| Restraint | (~) % Impact on CAGR Forecast | Geographic Relevance | Impact Timeline |
|---|---|---|---|
| High upfront CAPEX for large systems | -3.70% | Global, acute in low-income rural areas | Short term (≤ 2 years) |
| Intermittent policy support / subsidy cuts | -2.90% | Brazil, Argentina, India, select African markets | Medium term (2-4 years) |
| Saturation of early-adopter households | -1.40% | Kenya, Tanzania, Uganda, Bangladesh | Long term (≥ 4 years) |
| Used-panel dumping undermines quality trust | -0.80% | West Africa, South & Southeast Asia | Medium term (2-4 years) |
| Source: Mordor Intelligence | |||
High Upfront CAPEX for Large Systems
Telecom hybrid systems need USD 20,000–60,000, and Nigerian towers still face >12% local-currency debt unless risk guarantees cut rates by 300–400 bps. In India, PM-KUSUM Component A obliges 40–50% farmer co-funding; states with <30% credit penetration force reliance on informal 18–24% loans that erode project IRRs. Mini-grid developers across Nigeria secured financial close on only 15% of a USD 1.6 billion pipeline by early 2025 because lenders seek 25% equity IRRs.
Intermittent Policy Support / Subsidy Cuts
Brazil’s 2023 net-metering rule cut export credits to 70%, slashing distributed additions 40% in 2024. Argentina’s 300% peso slide between 2023 and 2025 stalled RenovAr, while India’s DISCOM delays left PM-KUSUM underfunded at just 75% of annual allocations. Kenya reinstated a 16% VAT on solar products in 2024, lifting prices 12–15% and dragging PAYGo sales by one-fifth in 1H 2025.
Segment Analysis
By Technology: Photovoltaics Anchor Distributed Supply
Solar PV accounted for 100% of capacity in 2025, mirroring the overall off-grid solar energy market size trajectory. Concentrated solar power’s 10 MW minimum scale and molten-salt storage cost of USD 50–80 per kWh remain uneconomic for the 50 kW–5 MW band, where the off-grid solar energy market thrives. Over the forecast horizon, perovskite-silicon tandems entering bankability by 2027 could pare total installed cost 20–30%, compressing payback periods across mini-grids. Bifacial modules already raise yield 5–30% and expand the off-grid solar energy market share of bifacial shipments, especially in high-albedo Sahel zones. However, lead-related certification hurdles may delay perovskite adoption, tempering near-term upside.
Continuous LFP price declines align with module efficiency gains, keeping the off-grid solar energy market on its steep learning curve. With thin-film cadmium-telluride capped by tellurium supply, crystalline and tandem PV will continue to dominate volume. Edge-of-grid microinverters offering grid-forming capability, launched by Enphase in 2024, will likely remain a grid-connected feature rather than an off-grid standard because unit pricing exceeds USD 0.25 per watt and connectivity requirements strain rural networks.
Note: Segment shares of all individual segments available upon report purchase
By End-User: C&I Sites Accelerate on Diesel Displacement
Residential pay-go solutions held 52.9% of 2025 volume but face rising default risk, whereas C&I demand is poised to capture a growing off-grid solar energy market share through 2031. Telecom operators achieve 99% uptime and USD 1.5 million annual diesel savings at Nigerian pilot sites, validating 3–5 year paybacks without subsidy. Cold-chain and agribusiness users join the trend; a 6 MW Australian orchard system with 4.5 MWh storage erased 35% in demand charges.
C&I projects also secure cheaper debt, 10–12% compared with the 15–20% typical for PAYGo portfolios, because cash-flow visibility is stronger, reducing weighted average cost of capital by 300–500 bps. Conversely, saturation in early-adopter households across Kenya and Tanzania slows new unit sales, pushing PAYGo platforms toward appliance finance to lift lifetime customer value. These dynamics will narrow the residential share of the off-grid solar energy market size after 2028 while C&I expands at a high-teens clip.
Note: Segment shares of all individual segments available upon report purchase
Geography Analysis
Asia-Pacific dominated the off-grid solar energy market with 59.87% capacity in 2025. Yet India’s PM-KUSUM realized only 9% of its 30.8 GW goal by mid-2024, indicating bureaucratic lag amid abundant potential. Indonesia’s 2,500 unelectrified villages highlight IRR compression to <8% without sovereign guarantees, constraining private build-out. The Philippines targets 100% household electrification by 2027, focusing on mini-grids where extension costs exceed USD 10,000 per km, but land-title disputes extend lead times past 18 months.
The Middle East and Africa region is forecast to have a 26.3% CAGR, faster than the global off-grid solar energy market. Nigeria’s DARES taps USD 1.85 billion to roll out 1,350 mini-grids, some grid-interactive for ancillary-service revenue. Kenyan PAYGo leaders secured USD 156 million in 2025 for 1 million systems, while Gulf investors such as Amea Power financed a 50 MW Ivory Coast plant coming online in 2027. Forex swings remain the key brake; a 68% naira drop in 2024 forced d.light to hedge via multi-currency notes, adding 150–200 bps to issuance spreads.
North America, Europe, and South America combined sit below 15% of the off-grid solar energy market size due to near-universal grid reach. Canada devoted CAD 300 million to replace diesel in 292 remote First Nations communities, but Arctic latitude cuts solar capacity factors to 8–12%, slowing uptake. Brazil’s 2023 net-metering revision shrank distributed growth 40% in 2024, while Argentina’s peso devaluation froze its RenovAr pipeline. Europe’s limited demand centers on island or highland tourism assets where diesel prices supply the arbitrage.
Competitive Landscape
Top Companies in Off-Grid Solar Energy Market
Two clusters shape competitive intensity. Chinese module makers LONGi, Trina Solar, JinkoSolar, and JA Solar jointly control 85% of global PV output, anchoring hardware supply for the off-grid solar energy market. LONGi posted a CNY 10.4 billion 2024 net loss and cut 30% of staff amid margin squeeze, whereas Trina grew profit to CNY 5.14 billion by leaning into premium bifacial modules. On the downstream side, PAYGo specialists such as d.light, M-KOPA, Sun King, Husk Power, and the newly merged Ignite Power–ENGIE Energy Access entity compete on distribution footprint and fintech underwriting. Ignite’s USD 200 million buyout of ENGIE Energy Access in September 2025 vaulted the combined base to 15 million customers and unlocked 200 bps funding cost savings via scale.
Mini-grid developers like Renewvia and Powerhive exploit concessional DFI debt at 6–8%, underpricing commercial peers by 400–600 bps. Technology suppliers Huawei FusionSolar and SMA Solar push AI-based predictive O&M that trims downtime 20–30%, yet low rural connectivity limits penetration below 10% in Africa. White-space growth areas include telecom tower retrofits, cold-chain logistics, and mini-grid-to-grid integration for ancillary revenues, each requiring bundled tender structures to clear upfront funding hurdles.
Off-Grid Solar Energy Industry Leaders
ABB Ltd
Canadian Solar Inc.
JinkoSolar Holding Co., Ltd
SunPower Corporation
Trina Solar Ltd
- *Disclaimer: Major Players sorted in no particular order
Recent Industry Developments
- February 2026: Renewvia secured USD 10 million Series B from Claritas Capital to build 50 mini-grids in Kenya and Nigeria.
- September 2025: Ignite Power acquired ENGIE Energy Access for USD 200 million, creating a 15-million-customer platform.
- July 2025: d.light expanded securitization by USD 300 million, totaling USD 842 million across five tranches.
- July 2025: Sun King securitized USD 156 million for 1 million East African systems.
Global Off-Grid Solar Energy Market Report Scope
Off-grid systems operate independently of the power grid but include batteries that can store the solar energy generated by the device. Solar panels, a battery, a charge controller, a grid box, an inverter, a mounting framework, and a system balance are typically included in the system. The panels collect enough sunlight during the day and utilize the excess power created at night to generate electricity.
The off-grid solar energy market is segmented by technology, end user, and geography. By technology, the market is segmented into solar photovoltaic (PV) and concentrated solar power (CSP). By end user, the market is segmented into utility-scale, commercial and industrial (C&I), and residential. The report also covers market sizes and forecasts for the off-grid solar energy market across major regions. The market sizing and forecasts for each segment are based on installed capacity (GW).
| Solar Photovoltaic (PV) |
| Concentrated Solar Power (CSP) |
| Utility-Scale |
| Commercial and Industrial (C&I) |
| Residential |
| Solar Modules/Panels |
| Inverters (String, Central, Micro) |
| Mounting and Tracking Systems |
| Balance-of-System and Electricals |
| Energy Storage and Hybrid Integration |
| North America | United States |
| Canada | |
| Mexico | |
| Europe | United Kingdom |
| Germany | |
| France | |
| Spain | |
| Nordic Countries | |
| Russia | |
| Rest of Europe | |
| Asia-Pacific | China |
| India | |
| Japan | |
| South Korea | |
| Malaysia | |
| Thailand | |
| Indonesia | |
| Vietnam | |
| Australia | |
| Rest of Asia-Pacific | |
| South America | Brazil |
| Argentina | |
| Colombia | |
| Rest of South America | |
| Middle East and Africa | United Arab Emirates |
| Saudi Arabia | |
| South Africa | |
| Egypt | |
| Rest of Middle East and Africa |
| By Technology | Solar Photovoltaic (PV) | |
| Concentrated Solar Power (CSP) | ||
| By End-User | Utility-Scale | |
| Commercial and Industrial (C&I) | ||
| Residential | ||
| By Component (Qualitative Analysis) | Solar Modules/Panels | |
| Inverters (String, Central, Micro) | ||
| Mounting and Tracking Systems | ||
| Balance-of-System and Electricals | ||
| Energy Storage and Hybrid Integration | ||
| By Geography | North America | United States |
| Canada | ||
| Mexico | ||
| Europe | United Kingdom | |
| Germany | ||
| France | ||
| Spain | ||
| Nordic Countries | ||
| Russia | ||
| Rest of Europe | ||
| Asia-Pacific | China | |
| India | ||
| Japan | ||
| South Korea | ||
| Malaysia | ||
| Thailand | ||
| Indonesia | ||
| Vietnam | ||
| Australia | ||
| Rest of Asia-Pacific | ||
| South America | Brazil | |
| Argentina | ||
| Colombia | ||
| Rest of South America | ||
| Middle East and Africa | United Arab Emirates | |
| Saudi Arabia | ||
| South Africa | ||
| Egypt | ||
| Rest of Middle East and Africa | ||
Key Questions Answered in the Report
What is the projected capacity of the off-grid solar energy market by 2031?
Installed capacity is forecast to reach 40.02 GW, advancing at a 22.21% CAGR from 2026 to 2031.
Which region will grow fastest through 2031?
The Middle East and Africa region is expected to record a 26.3% CAGR, outpacing all other geographies.
How are battery costs influencing project economics?
Lithium-ion pack prices of USD 108 per kWh in 2025 and stationary system costs of USD 70 per kWh have cut multi-day autonomy capital expenses by roughly one-fifth.
Which end-user segment is expanding quickest?
Commercial and industrial users, led by telecom tower retrofits, are projected to grow at 26.8% CAGR through 2031.
What factors threaten continued module price declines?
China's removal of the 9% export VAT rebate and record silver prices have narrowed manufacturing margins, signaling a potential pause in historic deflation.
How big is the financing gap for universal off-grid electrification?
The International Solar Alliance estimates USD 192 billion is required, versus only USD 3.8 billion raised by companies over 2012-2024, leaving a gap of almost fifty-fold.


